GridScout for traders
The network moves the market. See it first.
Constraints, outages and interconnector limits set regional prices as much as supply and demand. GridScout shows how the network shapes prices, curtailment and flows across the NEM, ahead of the event and after it.
The problem today
More price events now have a network story.
Price separation, curtailment and interconnector limits all trace back to constraints and outages. But often these relationships are buried in complex tables and charting relationships.
The network is a blind spot
Desks watch price, demand and weather closely, but constraint and outage detail stays raw and hard to read. When the network drives the move, the desk is reacting after the fact.
Outages move markets quietly
The outage schedule is public, but mapping it to prices, curtailment and interconnector flows is manual work. Scarcity setups hide in plain sight until the price arrives.
Constraints change under you
Constraint formulations are revised all the time, and a reworked equation can change how a region trades. A view built on last season's constraints misprices today's market.
How GridScout helps
From the network event to the market outcome.
Market-wide network impacts
See how the network sets the price
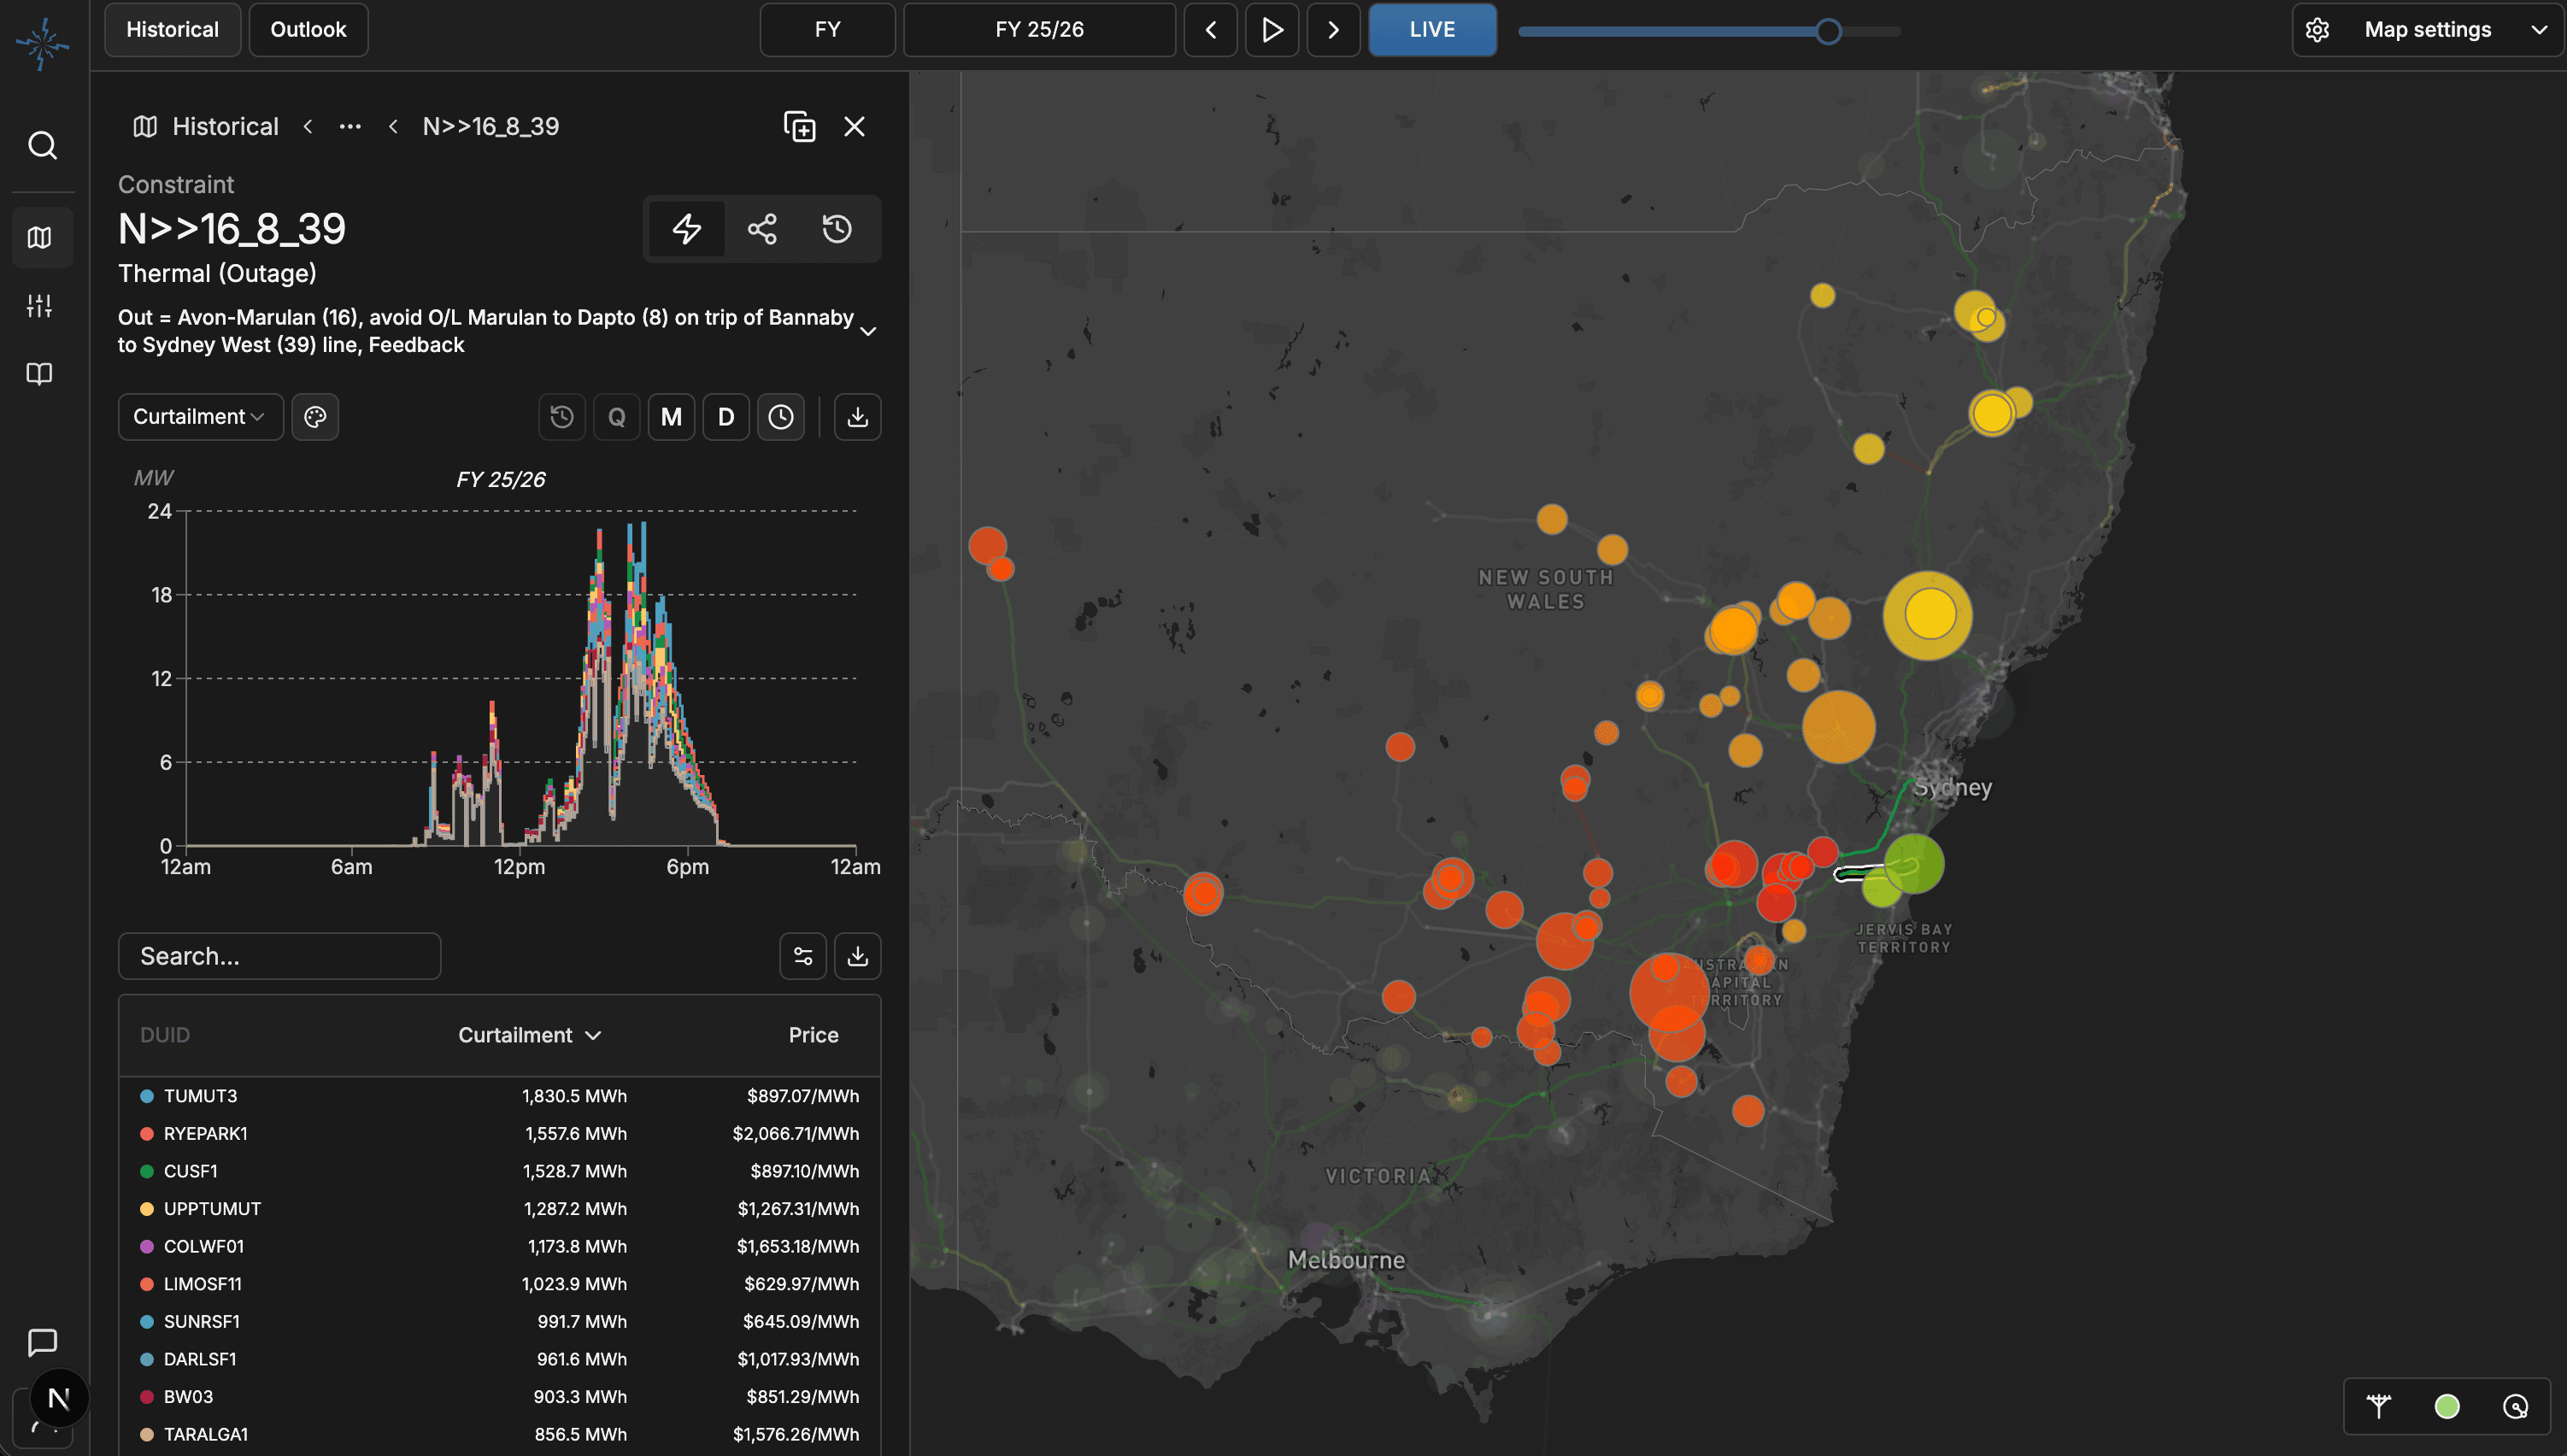
Prices, fleet curtailment, interconnector limits and flows in one connected view. Watch a binding constraint reshape dispatch, redirect flows and separate regional prices.
GridScout links these together, so a network event reads as one market story instead of disconnected data points.
Forward outage impacts (NOS)
Get ahead of outage-driven scarcity
GridScout takes the NOS market-wide. See how upcoming outages will affect curtailment, prices and interconnector flows across regions, not just a single unit.
Overlay outages on MT PASA to identify market scarcity early, and build your position before the market catches up.
Constraint tracking
Track constraints as they evolve
Follow the constraint equations that matter to your book: when they bind, what they cost, and how their market impact trends over time.
See changes to formulations as they land, so a revised term or limit never catches your positions off guard.
Built on the MMS dataset, with customisable export.
GridScout runs on AEMO's Market Management System data: dispatch, bids, constraints, outages and prices, live and historical. If it's in MMS, you can reach it in GridScout, without running your own database.
The payoff
Trade with the network in view.
Move first
Spot the network setups behind scarcity and price separation before they reach the screen.
One connected picture
Prices, curtailment and interconnector flows tied back to the constraints and outages driving them.
No formulation surprises
Constraint changes tracked as they happen, so your view of the market moves with the network.