In 2025, wind farms connected between Bannaby and Yass experienced between 1% and 2% network curtailment. However, this wiped 8–13% off their potential merchant revenue.
Curtailment tended to coincide with the highest wholesale electricity prices, meaning a small volume of lost generation carries an outsized financial cost.
Network outages, rather than system‑normal constraints, appeared to drive a significant share of curtailed energy and an even larger share of lost revenue.
For one wind farm unit, CROOKWF3, outage-related constraints accounted for 82% of curtailed energy and 91% of lost merchant revenue in 2025.
Offtake agreements can reduce exposure to pricing asymmetry, whereas full merchant projects face a structurally different risk profile at these connection points. From the offtaker's perspective, this raises further questions about how they price this risk.
Introduction
Connection point selection is becoming an increasingly important factor for a project's long-term success. Even so, many established approaches still lean on the traditional formula of utilisation, ratings, and curtailment quantity. The Bannaby to Yass corridor in New South Wales appears to be a strong performer based on these metrics. Financial outcomes, however, suggest this may not tell the whole story.
A strong connection point
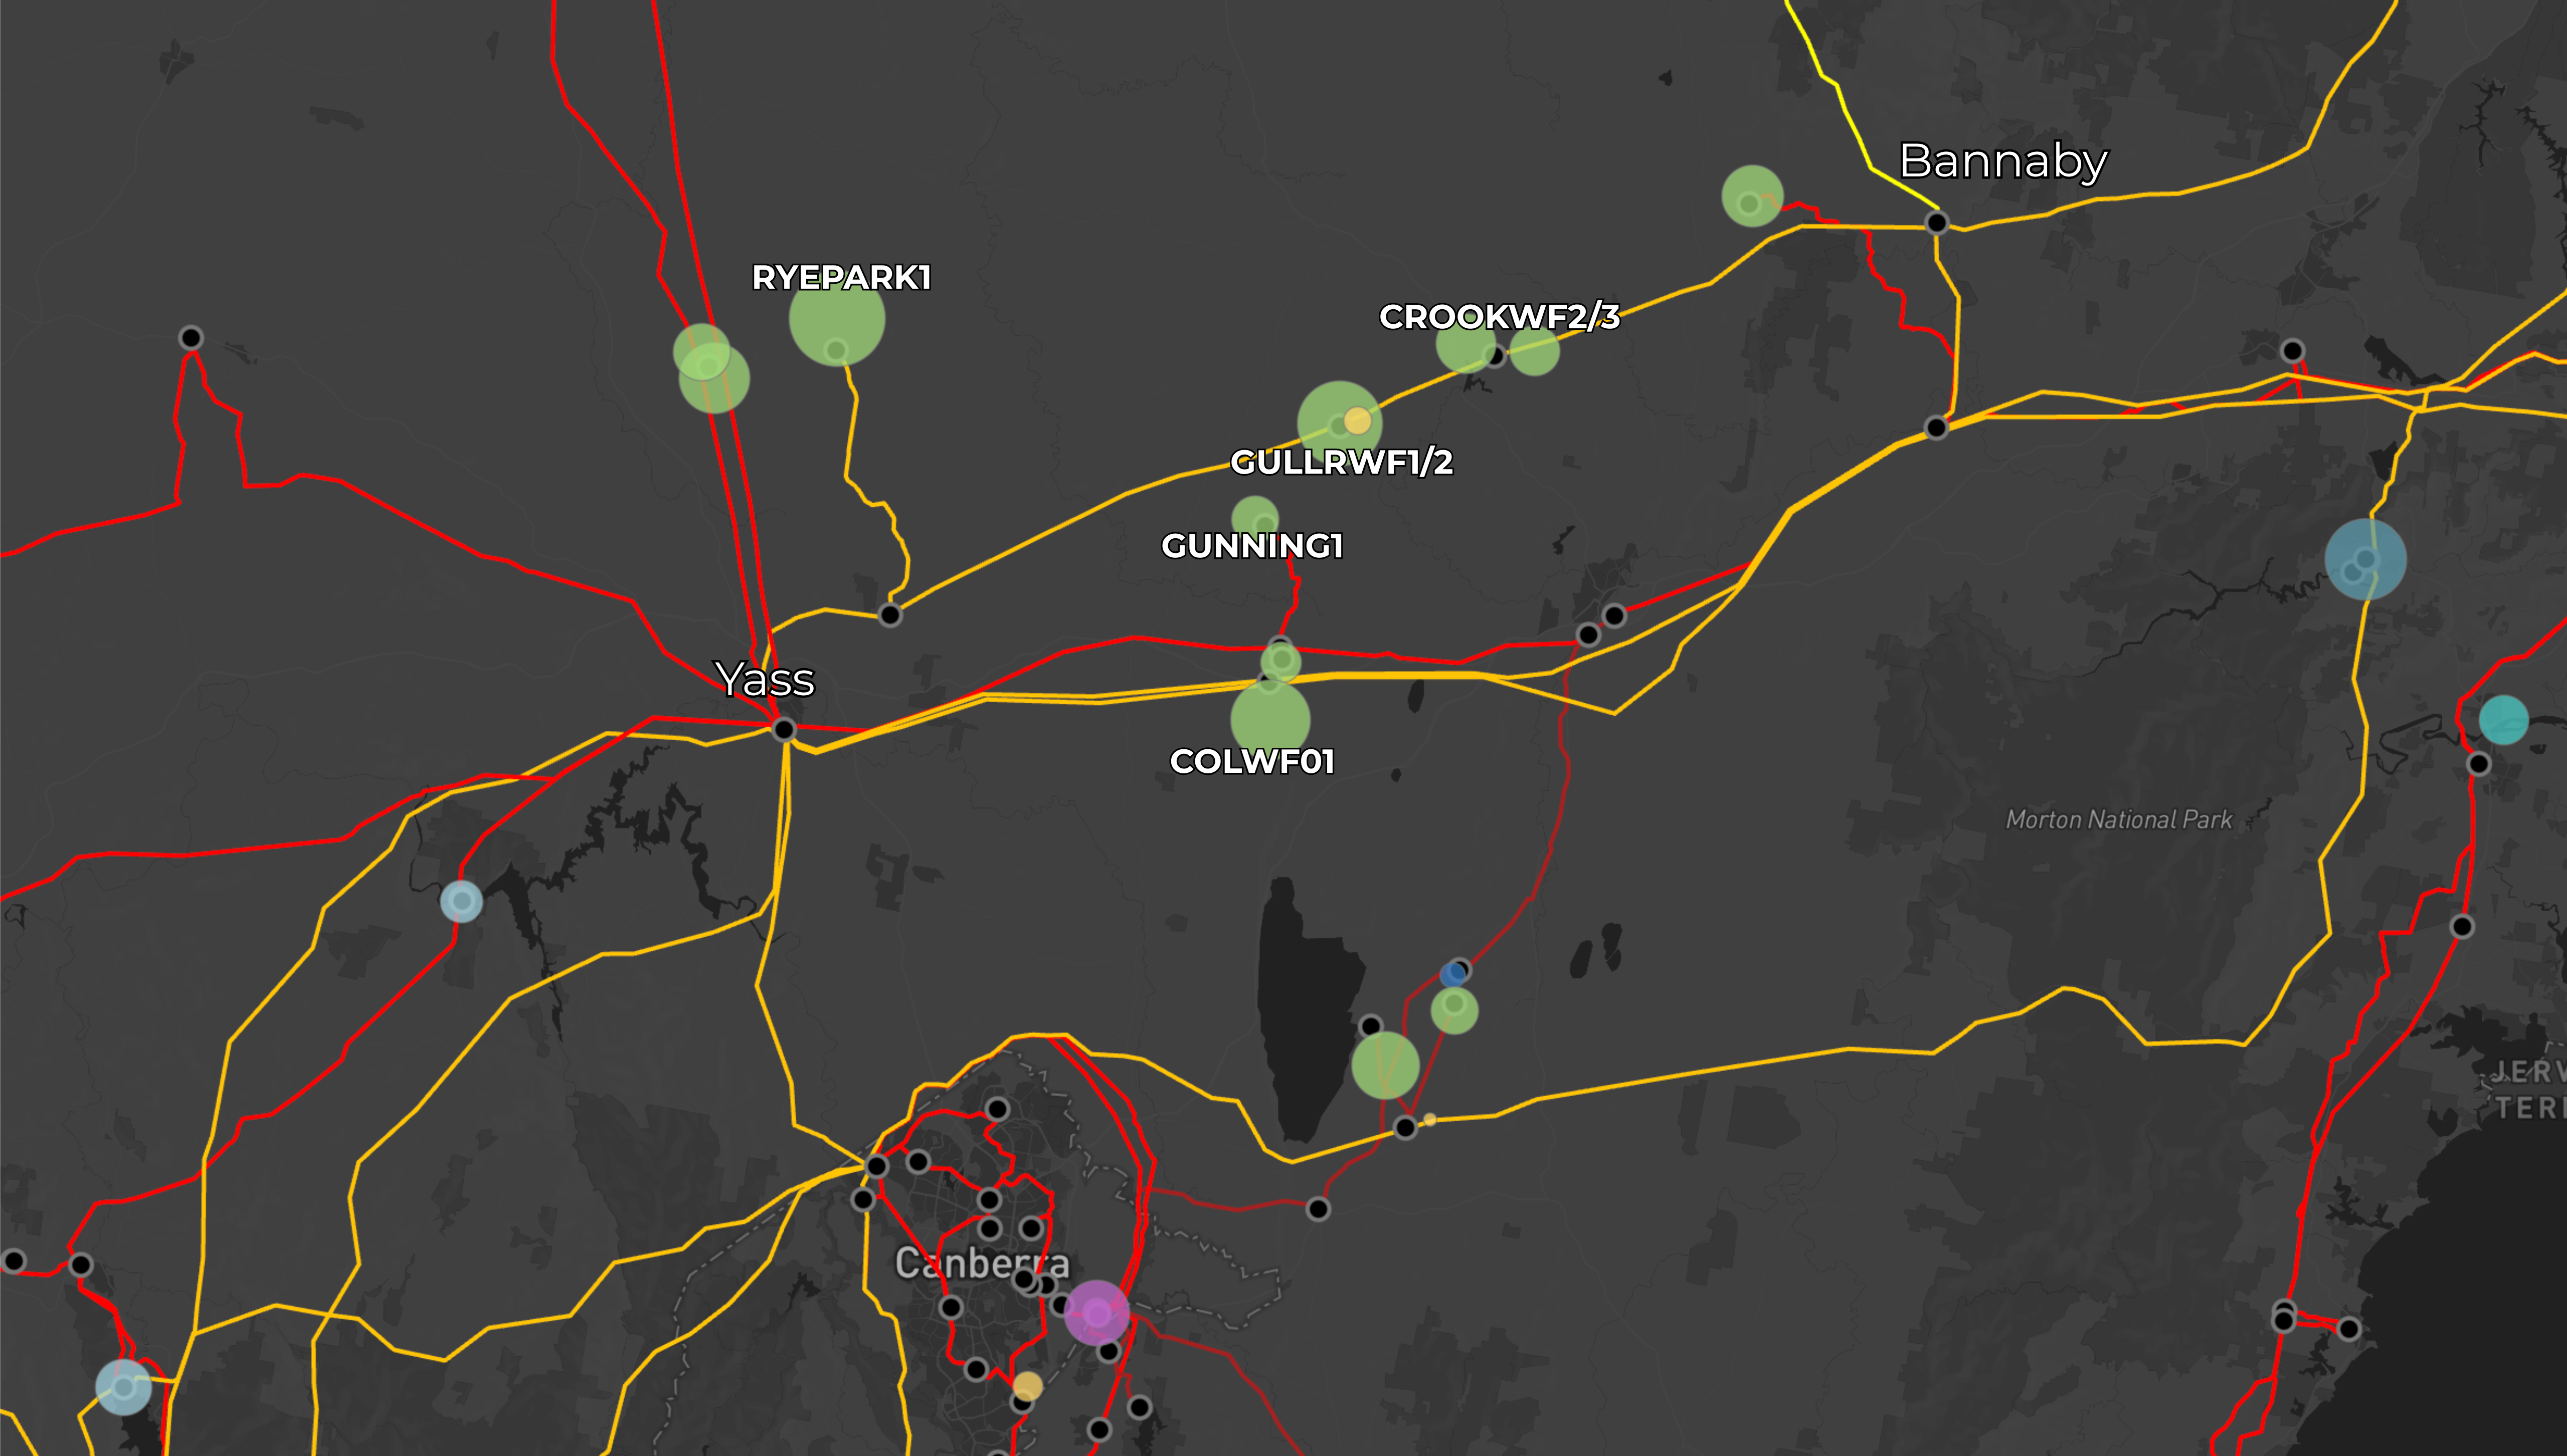
The Bannaby to Yass corridor runs 160 kilometres across the Southern Tablelands; elevated, windswept country where long ridgelines and consistent wind resources have drawn a cluster of generation projects onto the 330 kV transmission network.
On paper, the corridor ticks every box: high-capacity lines, solid headroom, and proximity to major load centres. It is, by most conventional measures, prime ground for renewable energy development.
Operational indicators reinforce this impression. In 2025, network curtailment across these wind farms averaged just 1–2% of total availability, a level that would typically signal low grid-related risk for developers and investors.
However, the financial data reveals a different picture.
The gap between curtailment and revenue
Across the corridor, a clear pattern emerges. Curtailment volumes are low, but the financial impact is disproportionate. In 2025, Crookwell Wind Farm 3 (CROOKWF3) lost just 1.4% of its energy to curtailment, yet that alone wiped 13% off its potential merchant revenue. This is not isolated. Every wind farm in the corridor shows the same imbalance: merchant revenue losses running at several multiples of the curtailment volume itself.
| DUID | Merchant Revenue ($m) | Network curtailment Rev. Loss ($m) | Network curtailment (%) | Rev. Loss (%) |
|---|---|---|---|---|
| CROOKWF3 | 12.03 | 1.83 | 1.4 | 13 |
| CROOKWF2 | 19.16 | 2.46 | 2.1 | 11 |
| COLWF01 | 38.53 | 4.39 | 1.4 | 10 |
| GULLRWF2 | 27.49 | 2.81 | 1.6 | 9 |
| GULLRWF1 | 33.11 | 3.07 | 1.3 | 8 |
| RYEPARK1 | 89.21 | 7.73 | 1.1 | 8 |
| GUNNING1 | 12.20 | 0.37 | 0.4 | 3 |
The mechanism is straightforward. Curtailment peaks in the hours when wholesale prices are highest; one hallmark of network-driven curtailment, where generators are wound back precisely when the market is paying the most for their output. It is timing, not volume, that turns 1–2% curtailment into 8–13% revenue losses.
System normal to system never
To further understand the drivers, consider CROOKWF3, the hardest-hit unit in the corridor. Its curtailment is not the result of a single constraint binding steadily across the year. Instead, large volumes are concentrated in specific months, tied directly to specific network outages.
Of the 40 constraints that drove CROOKWF3's curtailment in 2025, 32 were the result of network outages. These outage constraints not only coincided with higher market prices, but contributed to them. As a result, in 2025, network outages accounted for 82% of total curtailed energy and 91% of total lost revenue for CROOKWF3.
The same pattern appeared across all wind farms connected between Bannaby and Yass, suggesting the dynamic is structural to the wider network corridor rather than specific to any one project. To understand why, it is important to look at what's happening on the transmission lines themselves.
The network sets the pace
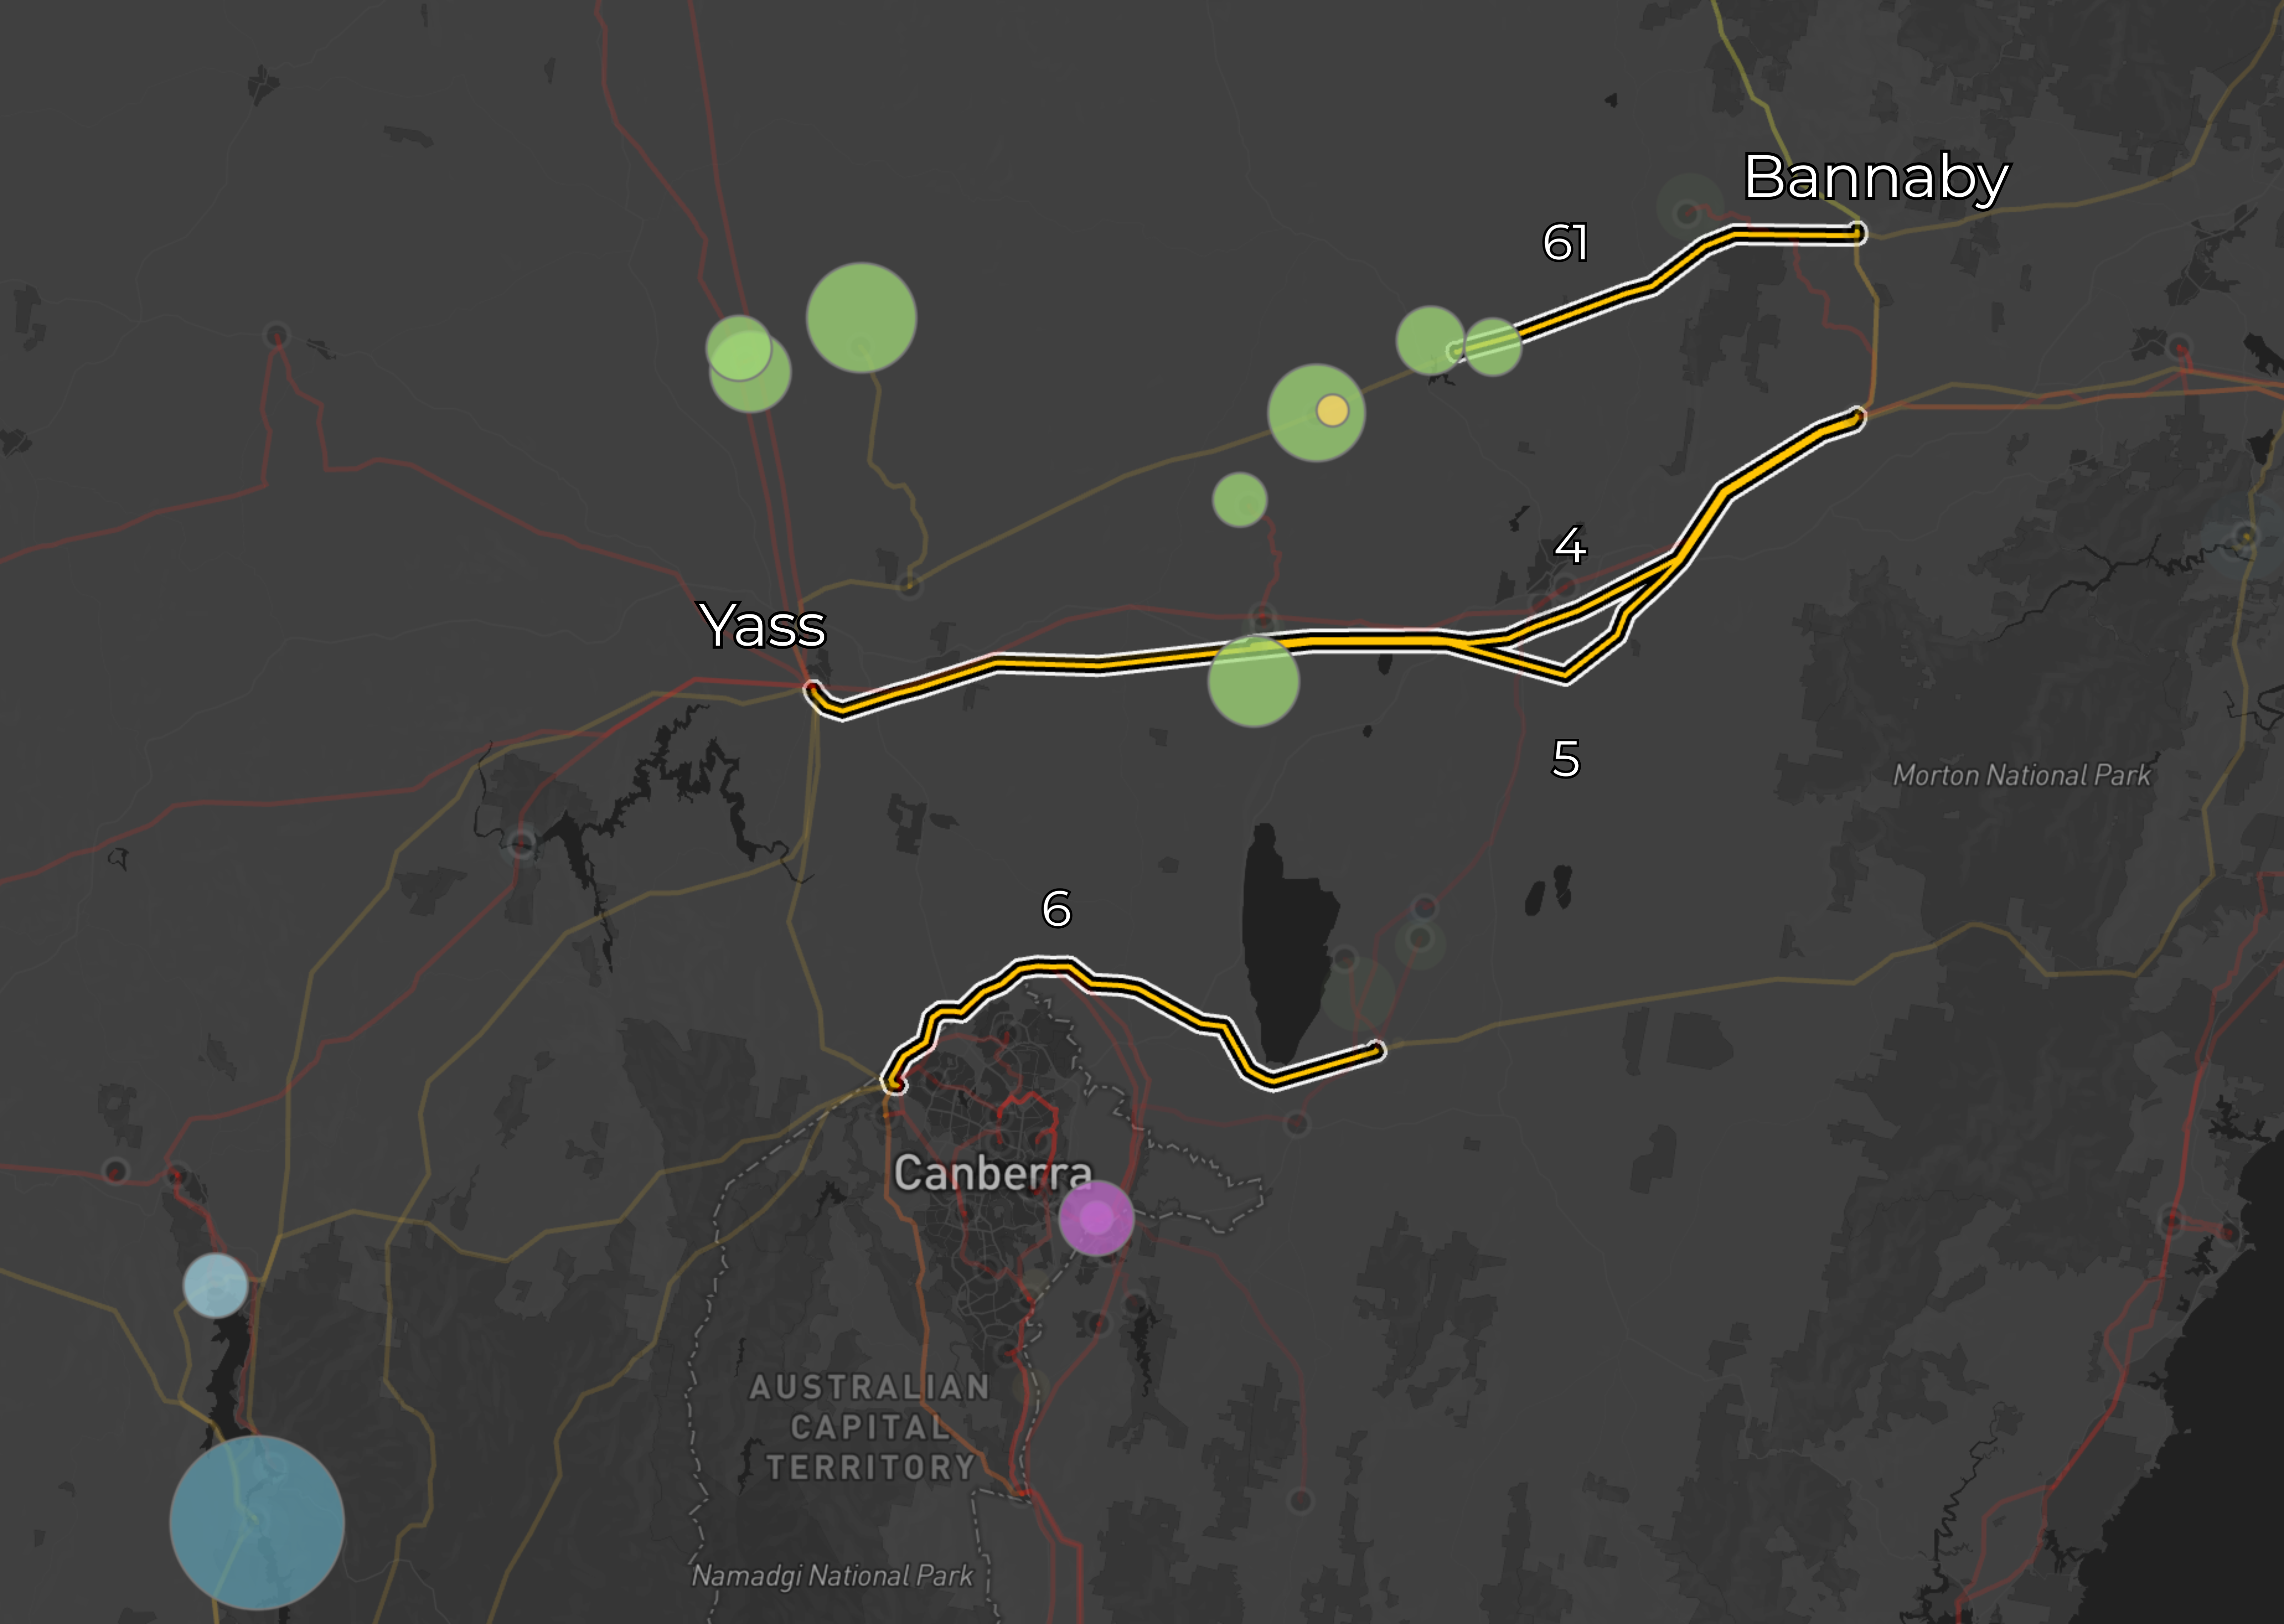
The Bannaby to Yass corridor serves as a primary route for moving power from Southern NSW towards the load centre in Sydney. When any line along or feeding into this pathway is taken out of service for maintenance, the available transfer capacity drops. To manage system stability, AEMO applies transient stability constraints that limit flows along lines 4, 5, 6 and 61, the four transmission lines that define the corridor.
Assuming all units bid at or near the market floor (as most renewable generators do to maximise dispatch in constrained intervals), AEMO curtails the generators contributing the most flow to the affected lines. The curtailment order is determined by each unit's participation factor, a value between –1 and 1 reflecting its electrical contribution to the constrained element(s). In this case, units with the highest positive participation factors are curtailed first.
The most significant constraint along this corridor in 2025 was N::N_CNLT_2, which is invoked when the Lower Tumut to Canberra (07) line is out of service.
N::N_CNLT_2 — Out = Lower Tumut–Canberra (07), stability limit (Snowy–NSW) for fault of various locations between Yass–South Morang area.
Under this constraint, Crookwell 2 and Crookwell 3 carried the highest participation factors at 1.0 each, followed by the remaining wind farms in the corridor, the Canberra-based batteries, and then the rest of the units in Southern and Central NSW.
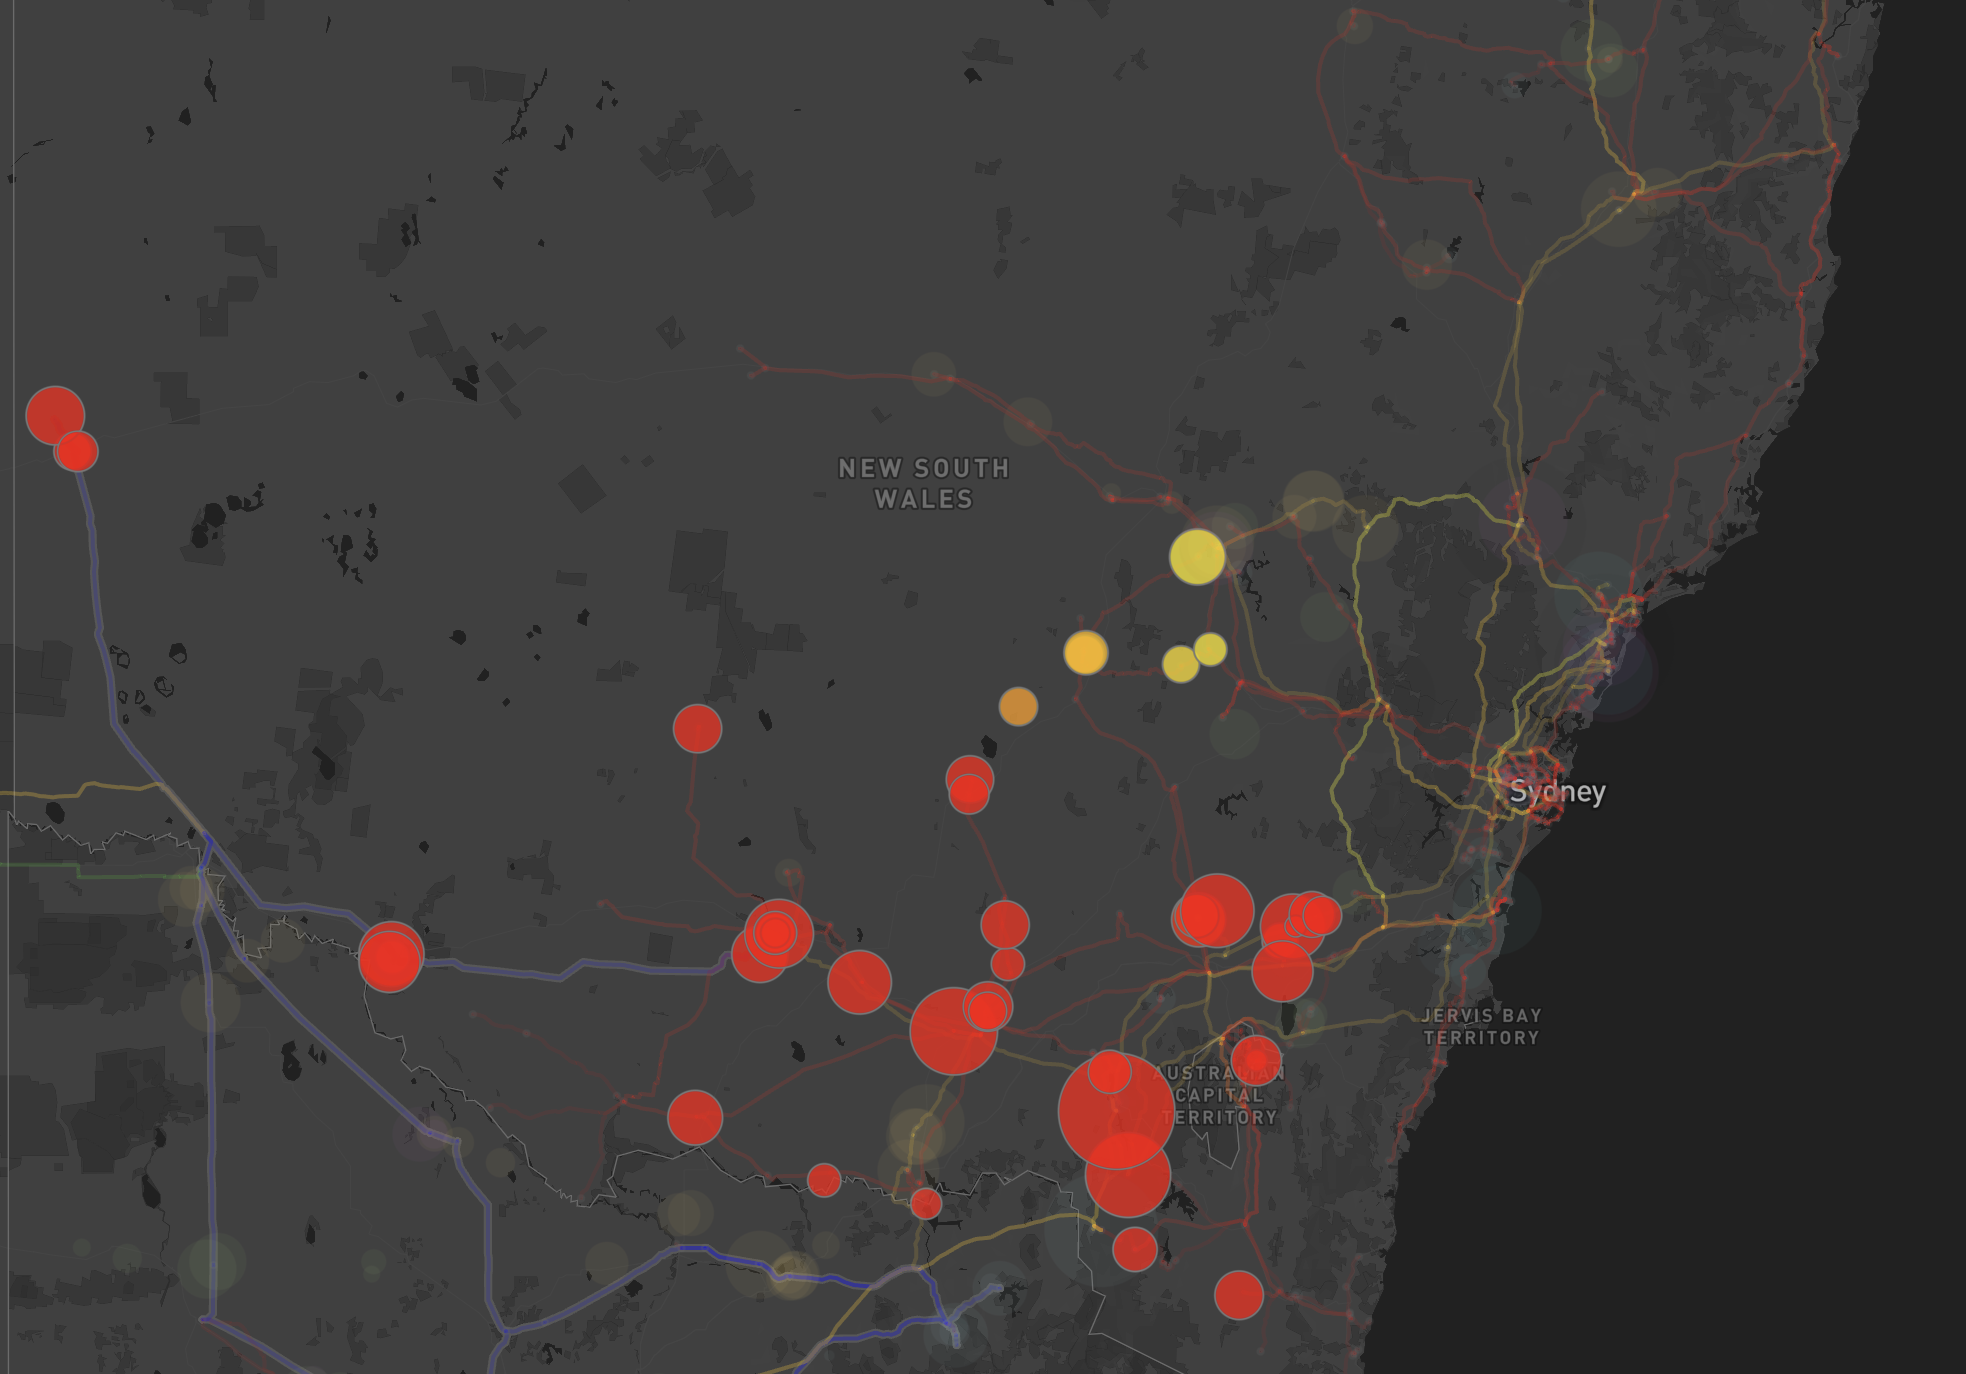
Since these units between Bannaby and Yass connect directly into lines 4, 5, 6 and 61, they consistently rank at the top of outage transient stability constraints across Southern NSW — not just for N::N_CNLT_2, but for nearly every transient stability constraint in this area. As a result, these units are the most exposed to curtailment risk when network outages occur in Southern NSW.
The road ahead for development and offtake strategies
While the Bannaby to Yass corridor is strong under normal system conditions, the network spends much of the year operating outside of the textbook state. The outage of a single 330 kV line in Southern NSW can significantly curtail generators connected along this route. Compounding the issue, these curtailment events frequently overlap with higher market prices, increasing the revenue impact.
However, financial exposure can vary considerably. For instance, many of the units along this corridor have offtake agreements that provide a degree of insulation from tail-pricing curtailment risk. In a location where high-price capture is less reliable due to network constraints, a well-priced offtake could shift some of the imbalance between curtailment volume and revenue impacts to the counterparty. In such circumstances, offtake arrangements might support a project's commercial position more effectively than a fully merchant approach.
From the counterparty's perspective, the offtake is priced on the assumption it delivers hedge value. In a corridor like Bannaby to Yass, the hedge is often structurally weakest when the spot market is most punishing.
Consider again CROOKWF3. In 2025, it recorded a Dispatch Weighted Average Price of $77/MWh against a Network Curtailment Weighted Average Price of $608/MWh.
Ultimately, the offtaker pays a strike price calibrated to an expected generation profile. Without proper care taken, what they could actually receive is settlement weighted toward lower-priced, unconstrained intervals — while still being exposed to higher-priced, constrained intervals in spot. This raises a broader question about what price the offtake is truly worth once the location and price specific curtailment profile is accounted for.
Beyond the traditional formula
The network isn't static; it's actively operated and continually shifting. Transmission elements move in and out of service for maintenance, upgrades, and unplanned events, and it is often in these moments that the traditional formula for selecting a development location can begin to show its limits. A site may appear ideal when assessed against headline metrics, yet those same metrics can mask how binding constraints interact with market prices, how frequently key transmission lines are unavailable, and how curtailment patterns change between outage conditions and normal operations.
The Bannaby to Yass corridor offers a useful illustration. For a fully contracted project with a favourable offtake, 1–2% network curtailment represents a relatively strong position. For a project fully exposed to merchant pricing, that same 1–2% curtailment could translate into a more material reduction in annual revenue. For an offtaker, it's worth asking what the delivered energy is truly worth.
In this context, choosing a connection point often proves to be more complex than the typical formula suggests. While it may be one of the first decisions a project will make, it is most certainly the one it will live with the longest. It's worth getting right.
¹ All data sourced from GridScout. Figures reflect historical performance and are subject to change. Past curtailment patterns and revenue outcomes may not be indicative of future results.